Bollinger Breakout Strategy with Direction Control [4H crypto]Bollinger Breakout Strategy with Direction Control - User Guide
This strategy leverages Bollinger Bands, RSI, and directional filters to identify potential breakout trading opportunities. It is designed for traders looking to capitalize on significant price movements while maintaining control over trade direction (long, short, or both). Here’s how to use this strategy effectively:
How the Strategy Works
Indicators Used:
Bollinger Bands:
A volatility-based indicator with an upper and lower band around a simple moving average (SMA). The bands expand or contract based on market volatility.
RSI (Relative Strength Index):
Measures momentum to determine overbought or oversold conditions. In this strategy, RSI is used to confirm breakout strength.
Trade Direction Control:
You can select whether to trade:
Long only: Buy positions.
Short only: Sell positions.
Both: Trade in both directions depending on conditions.
Breakout Conditions:
Long Trade:
The price closes above the upper Bollinger Band.
RSI is above the midline (50), confirming upward momentum.
The "Trade Direction" setting allows either "Long" or "Both."
Short Trade:
The price closes below the lower Bollinger Band.
RSI is below the midline (50), confirming downward momentum.
The "Trade Direction" setting allows either "Short" or "Both."
Risk Management:
Stop-Loss:
Long trades: Set at 2% below the entry price.
Short trades: Set at 2% above the entry price.
Take-Profit:
Calculated using a Risk/Reward Ratio (default is 2:1).
Adjust this in the strategy settings.
Inputs and Customization
Key Parameters:
Bollinger Bands Length: Default is 20. Adjust based on the desired sensitivity.
Multiplier: Default is 2.0. Higher values widen the bands; lower values narrow them.
RSI Length: Default is 14, which is standard for RSI.
Risk/Reward Ratio: Default is 2.0. Increase for more aggressive profit targets, decrease for conservative exits.
Trade Direction:
Options: "Long," "Short," or "Both."
Example: Set to "Long" in a bullish market to focus only on buy trades.
How to Use This Strategy
Adding the Strategy:
Paste the script into TradingView’s Pine Editor and add it to your chart.
Setting Parameters:
Adjust the Bollinger Band settings, RSI, and Risk/Reward Ratio to fit the asset and timeframe you're trading.
Analyzing Signals:
Green line (Upper Band): Signals breakout potential for long trades.
Red line (Lower Band): Signals breakout potential for short trades.
Blue line (Basis): Central Bollinger Band (SMA), helpful for understanding price trends.
Testing the Strategy:
Use the Strategy Tester in TradingView to backtest performance on your chosen asset and timeframe.
Optimizing for Assets:
Forex pairs, cryptocurrencies (like BTC), or stocks with high volatility are ideal for this strategy.
Works best on higher timeframes like 4H or Daily.
Best Practices
Combine with Volume: Confirm breakouts with increased volume for higher reliability.
Avoid Sideways Markets: Use additional trend filters (like ADX) to avoid trades in low-volatility conditions.
Optimize Parameters: Regularly adjust the Bollinger Bands multiplier and RSI settings to match the asset's behavior.
By utilizing this strategy, you can effectively trade breakouts while maintaining flexibility in trade direction. Adjust the parameters to match your trading style and market conditions for optimal results!
Cari dalam skrip untuk "stop loss"

Harmony Signal Flow By ArunThis Pine Script strategy, titled "Harmony Signal Flow By Arun," uses the Relative Strength Index (RSI) indicator to generate buy and sell signals based on custom thresholds. The script incorporates stop-loss and target management and restricts new trades until the previous position closes. Here's a detailed description:
Custom RSI Metric:
The strategy calculates a 5-period RSI based on the closing price, aiming for a more responsive measure of price momentum.
RSI thresholds are defined:
Lower threshold (30): Indicates oversold conditions, triggering a potential buy.
Upper threshold (70): Indicates overbought conditions, prompting a possible sell.
Entry Conditions:
Buy Signal: The strategy initiates a buy order when the RSI crosses above the lower threshold (30), indicating a shift from oversold conditions.
Sell Signal: A sell order is triggered when the RSI crosses below the upper threshold (70), suggesting an overbought reversal.
Only one order (buy or sell) can be active at a time, ensuring that a new trade begins only when there’s no existing position.
Stop-Loss and Target Management:
For each trade, stop-loss and target conditions are applied to manage risk and secure profits.
For Buy Positions:
Stop-loss is set 100 points below the entry price.
Target is set 150 points above the entry price.
For Sell Positions:
Stop-loss is set 100 points above the entry price.
Target is 150 points below the entry price.
The strategy closes the trade when either the stop-loss or target is met, marking the trade as "closed" and allowing a new trade entry.
Trade Sequencing:
A new trade (buy or sell) is only permitted after the previous position hits either its stop-loss or target, preventing overlapping trades and ensuring clear trade sequences.
This sequential approach enhances risk management by ensuring only one active position at any time.
End-of-Day Closure:
All open positions are closed automatically at 3:25 PM (Indian market time) to avoid overnight exposure, ensuring the strategy remains strictly intraday.
The flag for trade entry is reset at the end of each day, enabling fresh trades the next day.
Chart Indicators:
The script plots buy and sell signals directly on the chart with visible labels.
It also displays the custom RSI metric with horizontal lines for the lower and upper thresholds, providing visual cues for entry and exit points.
Summary
This strategy is a momentum-based intraday trading approach that uses the RSI for identifying potential reversals and manages trades through predefined stop-loss and target levels. By enforcing trade sequencing and closing positions at the end of the trading day, it prioritizes risk management and seeks to capitalize on short-term trends while avoiding overnight market risks.

Supertrend StrategyThe Supertrend Strategy was created based on the Supertrend and Relative Strength Index (RSI) indicators, widely respected tools in technical analysis. This strategy combines these two indicators to capture market trends with precision and reliability, looking for optimizing exit levels at oversold or overbought price levels.
The Supertrend indicator identifies trend direction based on price and volatility by using the Average True Range (ATR). The ATR measures market volatility by calculating the average range between an asset’s high and low prices over a set period. It provides insight into price fluctuations, with higher ATR values indicating increased volatility and lower values suggesting stability. The Supertrend Indicator plots a line above or below the price, signaling potential buy or sell opportunities: when the price closes above the Supertrend line, an uptrend is indicated, while a close below the line suggests a downtrend. This line shifts as price movements and volatility levels change, acting as both a trailing stop loss and trend confirmation.
To enhance the Supertrend strategy, the Relative Strength Index (RSI) has been added as an exit criterion. As a momentum oscillator, the RSI indicates overbought (usually above 70) or oversold (usually below 30) conditions. This integration allows trades to close when the asset is overbought or oversold, capturing gains before a possible reversal, even if the percentage take profit level has not been reached. This mechanism aims to prevent losses due to market reversals before the Supertrend signal changes.
### Key Features
1. **Entry criteria**:
- The strategy uses the Supertrend indicator calculated by adding or subtracting a multiple of the ATR from the closing price, depending on the trend direction.
- When the price crosses above the Supertrend line, the strategy signals a long (buy) entry. Conversely, when the price crosses below, it signals a short (sell) entry.
- The strategy performs a reversal if there is an open position and a change in the direction of the supertrend occurs
2. **Exit criteria**:
- Take profit of 30% (default) on the average position price.
- Oversold (≤ 5) or overbought (≥ 95) RSI
- Reversal when there is a change in direction of the Supertrend
3. **No Repainting**:
- This strategy is not subject to repainting, as long as the timeframe configured on your chart is the same as the supertrend timeframe .
4. **Position Sizing by Equity and risk management**:
- This strategy has a default configuration to operate with 35% of the equity. At the time of opening the position, the supertrend line is typically positioned at about 12 to 16% of the entry price. This way, the strategy is putting at risk about 16% of 35% of equity, that is, around 5.6% of equity for each trade. The percentage of equity can be adjusted by the user according to their risk management.
5. **Backtest results**:
- This strategy was subjected to deep backtesting and operations in replay mode, including transaction fees of 0.12%, and slippage of 5 ticks.
- The past results in deep backtest and replay mode were compatible and profitable (Variable results depending on the take profit used, supertrend and RSI parameters). However, it should be noted that few operations were evaluated, since the currency in question has been created for a short time and the frequency of operations is relatively small.
- Past results are no guarantee of future results. The strategy's backtest results may even be due to overfitting with past data.
Default Settings
Chart timeframe: 2h
Supertrend Factor: 3.42
ATR period: 14
Supertrend timeframe: 2 h
RSI timeframe: 15 min
RSI Lenght: 5 min
RSI Upper limit: 95
RSI Lower Limit: 5
Take Profit: 30%
BYBIT:1000000MOGUSDT.P

MACD Trend Trading with Dynamic Position Sizing // AlgoFyreThe MACD Trend Trading with Dynamic Position Sizing strategy combines MACD and trend indicators for trend trading. It uses MACD crossovers to identify entry points and a trend source for directional bias. The strategy incorporates risk management through dynamic position sizing based on a fixed risk amount. It allows for both long and short positions with customizable stop-loss and take-profit levels. The script includes visualization options for entry, stop-loss, and take-profit levels, enhancing trade analysis.
TABLE OF CONTENTS
🔶 ORIGINALITY
🔸Dynamic Position Sizing
🔸Trend-MACD Combination
🔸Customizable Risk Management
🔶 FUNCTIONALITY
🔸Indicators
🞘 Trend Indicator
🞘 Moving Average Convergence Divergence (MACD)
🔸Conditions
🞘 Long Entry
🞘 Short Entry
🔶 INSTRUCTIONS
🔸Step-by-Step Guidelines
🞘 Setting Up the Strategy
🞘 Alerts
🔸Customize settings
🔶 CONCLUSION
▅▅▅▅▅▅▅▅▅▅▅▅▅▅▅▅▅▅▅▅▅▅▅▅▅▅▅▅▅▅▅▅▅▅▅▅▅▅▅▅▅▅▅▅▅
🔶 ORIGINALITY The MACD Trend Trading with Dynamic Position Sizing strategy uniquely combines MACD indicators with trend analysis to optimize entry and exit points. Unlike static trading strategies, it employs dynamic position sizing based on a fixed risk amount, ensuring consistent risk management. This approach allows traders to adapt to varying market conditions by adjusting position sizes according to predefined risk parameters, enhancing both flexibility and control in trading decisions. The strategy's integration of customizable stop-loss and take-profit levels further refines its risk management capabilities, making it a robust tool for both trending and volatile markets.
🔸Dynamic Position Sizing This strategy calculates position sizes dynamically, based on a fixed risk amount, allowing traders to maintain consistent risk exposure across trades.
🔸Trend-MACD Combination By combining trend direction with MACD crossovers, the strategy enhances the accuracy of entry signals, aligning trades with prevailing market trends.
🔸Customizable Risk Management Traders can set flexible risk-reward ratios and adjust stop-loss and take-profit levels, tailoring the strategy to their risk tolerance and market conditions.
🔶 FUNCTIONALITY The MACD Trend Trading with Dynamic Position Sizing strategy leverages a combination of trend indicators and the MACD to identify optimal trading opportunities. This strategy is designed to capitalize on short-term price movements by dynamically adjusting position sizes based on predefined risk parameters. It allows traders to manage risk effectively while taking advantage of both long and short positions.
🔸Indicators 🞘 Trend Indicator: Utilizes the trend source to determine market direction, ensuring trades align with prevailing trends.
Recommendation: We recommend using the Adaptive MAs (Hurst, CVaR, Fractal) indicator with the following settings for trend detection. However, you can use any trend indicator that suits your trading style.
🞘 Moving Average Convergence Divergence (MACD): Employs MACD crossovers to generate entry signals, enhancing the accuracy of trade execution. Use the "Moving Average Convergence Divergence" Indicator with the following settings:
🔸Conditions 🞘 Long Entry: Initiates a long position when the price is above the trend source, and a MACD crossover occurs with both MACD and signal lines below zero.
🞘 Short Entry: Initiates a short position when the price is below the trend source, and a MACD crossunder occurs with both MACD and signal lines above zero.
🔶 INSTRUCTIONS
The MACD Trend Trading with Dynamic Position Sizing strategy can be set up by adding it to your TradingView chart and configuring parameters such as the MACD source, trend source, and risk management settings. This strategy is designed to capitalize on short-term price movements by dynamically adjusting position sizes based on predefined risk parameters. Enhance the accuracy of signals by combining this strategy with additional indicators like trend-following or momentum-based tools. Adjust settings to better manage risk and optimize entry and exit points.
🔸Step-by-Step Guidelines
🞘 Setting Up the Strategy
Adding the Strategy to the Chart:
Go to your TradingView chart.
Click on the "Indicators" button at the top.
Search for "MACD Trend Trading with Dynamic Position Sizing" in the indicators list.
Click on the strategy to add it to your chart.
Configuring the Strategy:
Open the strategy settings by clicking on the gear icon next to its name on the chart.
MACD: Select the MACD from the MACD Indicator.
MACD Signal: Select the MACD Signal from the MACD Indicator.
Trend Source: Choose the trend source to determine market direction. If you use the Adaptive MAs (Hurst, CVaR, Fractal) with our settings shown above, choose the MA1 Smoothing Line.
Stop Loss Percentage: Set the stop loss distance from the trend source as a percentage.
Risk/Reward Ratio: Define the desired risk/reward ratio for trades.
Backtesting and Practice:
Backtest the strategy on historical data to understand how it performs in various market environments.
Practice using the strategy on a demo account before implementing it in live trading.
Market Awareness:
Keep an eye on market news and events that might cause extreme price movements. The strategy reacts to price data and might not account for news-driven events that can cause large deviations.
🔶 CONCLUSION
The MACD Trend Trading with Dynamic Position Sizing strategy provides a robust framework for capitalizing on short-term market trends by combining the MACD indicator with dynamic position sizing. This strategy leverages MACD crossovers to identify entry points and utilizes a trend source for directional bias, ensuring trades align with prevailing market conditions. By incorporating dynamic position sizing based on a fixed risk amount, traders can effectively manage risk and adapt to varying market conditions. The strategy's customizable stop-loss and take-profit levels further enhance its risk management capabilities, making it a versatile tool for both trending and volatile markets. With its strategic blend of technical indicators and risk management, the MACD Trend Trading strategy offers traders a comprehensive approach to optimizing trade execution and maximizing potential returns.

HFT V.2 EnhancedTitle: HFT V.2 Enhanced - ATR Dynamic Stop-Loss & Take-Profit
Description:
The HFT V.2 Enhanced strategy is designed for high-frequency trading with dynamic trade management and robust entry/exit logic. This strategy uses simple moving averages (SMA) for trend identification and the relative strength index (RSI) for momentum confirmation. In this enhanced version, the strategy also incorporates dynamic stop-loss and take-profit levels based on the Average True Range (ATR), offering better adaptability to market volatility.
Features:
Moving Average Crossover: Uses a fast and slow SMA to capture trend reversals and generate trade entries.
RSI Confirmation: Ensures momentum is in the direction of the trade by incorporating the RSI threshold for both long and short entries.
Dynamic Stop-Loss and Take-Profit: Stop-loss and take-profit levels are calculated based on the ATR, allowing the strategy to adjust its exit points according to market volatility. This helps manage risk more effectively and capture larger trends.
Auto-Close Opposing Positions: Automatically closes any open long positions when a short entry is triggered, and vice versa.
Once-Per-Bar Execution: Ensures that a position is entered only once per bar, avoiding multiple trades within the same bar.
Parameters:
Fast MA Length: Defines the length of the fast-moving average.
Slow MA Length: Defines the length of the slow-moving average.
RSI Length: Sets the period for the RSI indicator.
RSI Threshold: Controls the RSI level for confirming momentum (50 by default).
ATR Length: Determines the period for the ATR calculation.
ATR Multiplier for Stop-Loss/Take-Profit: Adjusts the sensitivity of the stop-loss and take-profit levels based on ATR.
How it Works:
Long Entry: The strategy opens a long trade when the fast SMA crosses above the slow SMA, and the RSI is above the user-defined threshold. A dynamic stop-loss is placed below the entry price, and a take-profit target is set based on ATR.
Short Entry: The strategy opens a short trade when the fast SMA crosses below the slow SMA, and the RSI is below the inverse threshold. A stop-loss is placed above the entry price, and a take-profit target is set using ATR.
Risk Management: The strategy adapts to changing market conditions by dynamically adjusting its stop-loss and take-profit levels, ensuring it remains responsive to market volatility.
This script is ideal for traders looking for a high-frequency strategy with advanced trade management, including dynamic exits and volatility-based risk management.
Disclaimer: Always backtest and optimize the parameters to fit your trading style and risk tolerance before using the strategy in live trading.

Trading TP SL### Detailed Explanation of the "Trading TP SL" Indicator:
#### 1. **Main Purpose of the Indicator**:
This Pine Script strategy is designed to automate trading decisions by using predefined Take Profit (TP) and Stop Loss (SL) levels for both buy and sell orders. It allows for visual representation of these levels on the chart through lines and labels.
---
#### 2. **Key Variables**:
- **Candle_length**: Specifies the number of candles used for calculating the Simple Moving Average (SMA).
- **Quantity_of_deals**: Defines the number of consecutive price conditions needed to trigger a trade.
- **SLbuy and SLsell**: Inputs for setting the stop loss level for buy and sell trades.
- **TPbuy1 - TPbuy4 and TPsell1 - TPsell4**: Inputs for specifying up to four take profit levels for buy and sell trades.
- **show_SL_buy and show_TP1_buy (and others)**: These options control whether the lines and labels for the specified levels are shown on the chart.
---
#### 3. **Buy Logic**:
- The script calculates the Simple Moving Average (SMA) using the number of candles specified by **Candle_length**.
- A condition is checked to see if the current price is above the SMA (**bcond = price > ma**).
- If this condition holds true for a number of candles equal to **Quantity_of_deals**, a buy trade is triggered with the command: `strategy.entry("BUY", strategy.long)`.
- The stop loss and take profit levels are calculated based on user inputs (in ticks).
##### Example:
- If the price is above the 50-period SMA, and this happens for 30 consecutive candles, a buy order will be triggered, with the corresponding SL and TP levels plotted on the chart.
---
#### 4. **Sell Logic**:
- The opposite logic applies for sell trades. If the price is below the SMA (**scond = price < ma**) for a number of candles equal to **Quantity_of_deals**, a sell trade is triggered using: `strategy.entry("SELL", strategy.short)`.
- Stop loss and take profit levels are calculated and displayed in the same way as for buy trades.
---
#### 5. **Displaying Lines and Labels**:
- Lines and labels are drawn on the chart to represent the SL and TP levels using the `line.new` and `label.new` functions.
- The visibility of these lines and labels is controlled by options like **show_SL_buy**, **show_TP1_buy**, **show_SL_sell**, etc.
##### Example:
- If **show_SL_buy** is enabled, a red line and label for the buy stop loss will appear on the chart, labeled "SL".
- The same applies for the take profit levels (TP1, TP2, etc.) and the sell orders.
---
#### 6. **Color Customization**:
- The script allows for customization of colors for different components:
- **SL_1**: The color of the buy stop loss line (red).
- **TP_1**: The color of the first take profit line for buy orders (green).
- **short1**: The color of the sell order line.
---
### Advantages:
- Full control over profit and stop loss levels.
- Flexibility to define the number of conditions required to trigger a trade.
- Options to show or hide levels on the chart, providing visual clarity.
---
### Conclusion:
This strategy is built around using the Simple Moving Average (SMA) to identify entry signals for both buy and sell trades. The stop loss and take profit levels are user-defined, with significant flexibility to customize and visualize them on the chart.
### شرح تفصيلي لمؤشر "Trading TP SL" المكتوب بلغة Pine Script:
#### 1. **الهدف الأساسي للمؤشر**:
المؤشر مصمم كاستراتيجية تداول مبنية على أوامر الشراء والبيع مع إعدادات خاصة بأهداف الربح (TP) ومستويات إيقاف الخسارة (SL). يتم تحديد هذه المستويات بشكل يدوي عن طريق المدخلات، مع إمكانية إظهار الخطوط والملصقات على الرسم البياني لتوضيح تلك المستويات.
---
#### 2. **المتغيرات الأساسية**:
- **Candle_length**: عدد الشموع المستخدمة لحساب المتوسط المتحرك البسيط (SMA).
- **Quantity_of_deals**: عدد الصفقات المطلوبة قبل تفعيل إشارة الدخول.
- **SLbuy و SLsell**: مستوى إيقاف الخسارة للشراء والبيع.
- **TPbuy1 - TPbuy4 و TPsell1 - TPsell4**: مستويات الربح المستهدفة (TP) للشراء والبيع.
- **show_SL_buy و show_TP1_buy (وما إلى ذلك)**: هذه الخيارات تظهر أو تخفي الخطوط والملصقات على الرسم البياني لكل مستوى من المستويات المحددة.
---
#### 3. **المنطق وراء الشراء**:
- يتم حساب المتوسط المتحرك البسيط (SMA) باستخدام الشموع المحددة في المتغير **Candle_length**.
- يتم التأكد مما إذا كان السعر الحالي أعلى من هذا المتوسط المتحرك البسيط (**bcond = price > ma**).
- إذا تحقق هذا الشرط لعدد من الشموع يساوي **Quantity_of_deals**، يتم تفعيل صفقة شراء باستخدام أمر: `strategy.entry("BUY", strategy.long)`.
- يتم حساب مستويات إيقاف الخسارة وأهداف الربح بناءً على القيمة المدخلة من المستخدم (القيمة بالنقاط).
##### مثال:
- إذا كان السعر الحالي أكبر من المتوسط المتحرك لمدة 50 شمعة، وحدث ذلك على التوالي لـ 30 شمعة، سيتم تفعيل صفقة شراء مع مستويات إيقاف الخسارة وأهداف الربح المعروضة على الرسم البياني.
---
#### 4. **المنطق وراء البيع**:
- يحدث العكس في حالة البيع. إذا كان السعر أقل من المتوسط المتحرك البسيط (**scond = price < ma**) وتحقق هذا الشرط لعدد من الشموع يساوي **Quantity_of_deals**، يتم تفعيل صفقة بيع باستخدام أمر: `strategy.entry("SELL", strategy.short)`.
- يتم حساب مستويات إيقاف الخسارة وأهداف الربح وفقًا للقيم المدخلة من المستخدم، وتظهر هذه المستويات على الرسم البياني.
---
#### 5. **إظهار الخطوط والملصقات**:
- يتم رسم الخطوط والملصقات على الرسم البياني لإيضاح المستويات (SL و TP) باستخدام دوال `line.new` و `label.new`.
- يمكنك التحكم في إظهار أو إخفاء هذه الخطوط والملصقات عن طريق الخيارات **show_SL_buy**, **show_TP1_buy**, **show_SL_sell**, إلخ.
##### مثال:
- إذا تم تفعيل خيار **show_SL_buy**، سيظهر خط إيقاف الخسارة للشراء على الرسم البياني بلون أحمر مع ملصق يُظهر "SL".
- يتم تكرار نفس الشيء لأهداف الربح (TP1, TP2, إلخ) وخطوط البيع.
---
#### 6. **ألوان المكونات**:
- الألوان لكل مستوى يمكن تخصيصها. على سبيل المثال:
- **SL_1**: لون إيقاف الخسارة للشراء (أحمر).
- **TP_1**: لون هدف الربح الأول للشراء (أخضر).
- **short1**: لون صفقة البيع.
---
### المزايا:
- التحكم الكامل في مستويات الربح والخسارة.
- إمكانية تخصيص عدد الصفقات المطلوبة لتفعيل إشارة الدخول.
- إظهار أو إخفاء المستويات على الرسم البياني وفقًا لرغبة المستخدم.
---
### الخلاصة:
هذه الاستراتيجية تعتمد على المتوسط المتحرك البسيط (SMA) لعدد معين من الشموع كإشارة دخول، سواء للشراء أو البيع. يتم تعيين مستويات الربح والخسارة يدويًا، مع توفير مرونة عالية في إظهار الخطوط والملصقات على الرسم البياني.

BigBeluga - BacktestingThe Backtesting System (SMC) is a strategy builder designed around concepts of Smart Money.
What makes this indicator unique is that users can build a wide variety of strategies thanks to the external source conditions and the built-in one that are coded around concepts of smart money.
🔶 FEATURES
🔹 Step Algorithm
Crafting Your Strategy:
You can add multiple steps to your strategy, using both internal and external (custom) conditions.
Evaluating Your Conditions:
The system evaluates your conditions sequentially.
Only after the previous step becomes true will the next one be evaluated.
This ensures your strategy only triggers when all specified conditions are met.
Executing Your Strategy:
Once all steps in your strategy are true, the backtester automatically opens a market order.
You can also configure exit conditions within the strategy builder to manage your positions effectively.
🔹 External and Internal build-in conditions
Users can choose to use external or internal conditions or just one of the two categories.
Build-in conditions:
CHoCH or BOS
CHoCH or BOS Sweep
CHoCH
BOS
CHoCH Sweep
BOS Sweep
OB Mitigated
Price Inside OB
FVG Mitigated
Raid Found
Price Inside FVG
SFP Created
Liquidity Print
Sweep Area
Breakdown of each of the options:
CHoCH: Change of Character (not Charter) is a change from bullish to bearish market or vice versa.
BOS: Break of Structure is a continuation of the current trend.
CHoCH or BOS Sweep: Liquidity taken out from the market within the structure.
OB Mitigated: An order block mitigated.
FVG Mitigated: An imbalance mitigated.
Raid Found: Liquidity taken out from an imbalance.
SFP Created: A Swing Failure Pattern detected.
Liquidity Print: A huge chunk of liquidity taken out from the market.
Sweep Area: A level regained from the structure.
Price inside OB/FVG: Price inside an order block or an imbalance.
External inputs can be anything that is plotted on the chart that has valid entry points, such as an RSI or a simple Supertrend.
Equal
Greather Than
Less Than
Crossing Over
Crossing Under
Crossing
🔹 Direction
Users can change the direction of each condition to either Bullish or Bearish. This can be useful if users want to long the market on a bearish condition or vice versa.
🔹 Build-in Stop-Loss and Take-Profit features
Tailoring Your Exits:
Similar to entry creation, the backtesting system allows you to build multi-step exit strategies.
Each step can utilize internal and external (custom) conditions.
This flexibility allows you to personalize your exit strategy based on your risk tolerance and trading goals.
Stop-Loss and Take-Profit Options:
The backtesting system offers various options for setting stop-loss and take-profit levels.
You can choose from:
Dynamic levels: These levels automatically adjust based on market movements, helping you manage risk and secure profits.
Specific price levels: You can set fixed stop-loss and take-profit levels based on your comfort level and analysis.
Price - Set x point to a specific price
Currency - Set x point away from tot Currency points
Ticks - Set x point away from tot ticks
Percent - Set x point away from a fixed %
ATR - Set x point away using the Averge True Range (200 bars)
Trailing Stop (Only for stop-loss order)
🔶 USAGE
Users can create a variety of strategies using this script, limited only by their imagination.
Long entry : Bullish CHoCH after price is inside a bullish order block
Short entry : Bearish CHoCH after price is inside a bearish order block
Stop-Loss : Trailing Stop set away from price by 0.2%
Example below using external conditions
Long entry : Bullish Liquidity Prints after bullish CHoCH
Short entry : Bearish Liquidity Prints after Bearish CHoCH
Long Exit : RSI Crossing over 70 line
Short Exit : RSI Crossing over 30 line
Stop-Loss : Trailing Stop set away from price by 0.3%
🔶 PROPERTIES
Users will need to adjust the property tabs according to their individual balance to achieve realistic results.
An important aspect to note is that past performance does not guarantee future results. This principle should always be kept in mind.
🔶 HOW TO ACCESS
You can see the Author Instructions to get access.
Skrip berbayar

FluxFilter Trend Strategy [BITsPIP]Hello fellow traders, I'm excited to share with you the FluxFilter Trend Strategy, a trading approach I've developed for those interested in exploring trend-following strategies. My goal was to create something straightforward and accessible, so traders looking to refine their portfolios can easily integrate its features. By the end of this guide, I hope you'll have a solid grasp of how the FluxFilter Trend Strategy functions, appreciate its benefits, understand its potential drawbacks, and see how it might fit into various trading contexts.
I) Overview
The FluxFilter Trend Strategy is tailored to align with the market's long-term trend. It examines the price data from the previous year to gauge the market's overall trajectory by employing moving averages. Subsequently, within shorter timeframes, the strategy utilizes a combination of modified Supertrend, Hull Suite, and various trend-following and filtering techniques to generate buy or sell signals. Although its advanced take profit and stop loss mechanisms might initially present a learning curve, they are integral to the strategy's effectiveness. They are designed to secure gains by capturing prevailing trends and mitigating the impact of false reversal signals.
II) Deep Backtesting
Deep backtesting stands as a cornerstone in the development of trading strategies, offering a robust method for traders to assess the performance of their strategy against historical data. This process yields a retrospective view, illustrating how the strategy might have navigated through past market fluctuations, thereby shedding light on its potential robustness and areas for refinement. However, it's crucial to acknowledge that a strategy's performance can be influenced by a myriad of factors including market dynamics, the chosen timeframe, and the inherent attributes of the traded asset. Consequently, it's advisable to conduct thorough backtesting under various conditions to ascertain the strategy's reliability before applying it to actual trading scenarios.
III) Benefits
A primary advantage of the FluxFilter Trend Strategy is its proficiency in discerning genuine market trends from mere price fluctuations, thereby avoiding premature or uncertain trades. Unlike approaches that take high risks on speculative trades, this strategy prioritizes a high degree of confidence in the direction of the trade. It meticulously waits for a clear confirmation of the market trend. Once this certainty is established, the strategy promptly generates trade signals, ensuring that traders are positioned to capitalize on optimal market entry points without delay. This approach not only enhances the potential for profit but also aligns with a disciplined and methodical trading ethos.
IV) Applications
FluxFilter Trend Strategy can be applied across various timeframes, with a particular efficacy in those under 15 minutes. Its adaptable framework means it can be customized to cater to a variety of asset classes, encompassing stocks, commodities, forex, and cryptocurrencies. Initially, the strategy was specifically calibrated for low-volatile cryptocurrencies, as reflected in the default settings for stop loss and take profit values. It's important to recognize that the unique volatility and trend patterns of your selected market necessitate careful adjustments to these parameters. This fine-tuning of profit targets and stop loss thresholds is crucial for aligning the strategy with the specific dynamics of your chosen market, which I will discuss shortly.
V) Strategy's Logic
1. Trend Identification: My conviction lies in the power of trend trading to yield long-term gains. Central to the FluxFilter Trend Strategy is the Hull Suite indicator, a tool developed by InSilico, serving as one of the confirmation indicators. This indicator acts as a compass for trend direction; a price residing above the Hull Suite line signals an uptrend, potentially marking an entry point for a buy position or confirming it. In contrast, a price positioned below this line suggests a downtrend, potentially indicating a strategic moment to sell or confirming the sell.
2. Noise Reduction: The financial markets are known for their 'noise'—short-lived price movements that can obscure the true market direction. The FluxFilter Trend Strategy is designed to sift through this noise, thereby facilitating more lucid and informed trading decisions. It employs a set of straightforward yet innovative techniques to single out significant misleading fluctuations. This is achieved by analyzing recent bars to spot bars with unusually large bodies, which often represent misleading market noise.
3. Risk Management: A key facet of the strategy is its emphasis on pragmatic risk management. Traders are empowered to establish practical stop-loss and take-profit levels, tailoring these crucial parameters to the specific market they are engaging in. This customization is instrumental in optimizing long-term profitability, ensuring that the strategy adapts fluidly to the unique characteristics and volatility patterns of different trading environments.
VI) Strategy's Input Settings and Default Values
1. Modified Supertrend
i. Factor: Serving as a multiplier in the Average True Range (ATR) calculation, this parameter adjusts the distance of the Supertrend line relative to the price chart. Elevating the factor value widens the gap between the Supertrend line and price, offering a more conservative stance. On the flip side, diminishing the factor value pulls the Supertrend line closer to the price action, heightening its sensitivity. While the preset value is 1, you have the flexibility to modify this to suit your trading approach.
ii. ATR Length: This defines the count of bars that are incorporated into the ATR computation, directly influencing the Supertrend's adaptability to market changes. With a default setting of 30 bars, it strikes a balance, smoothing over short-term fluctuations while maintaining a meaningful sensitivity to market trends. Adjusting this parameter allows you to tailor the indicator's responsiveness to suit your trading strategy, considering the volatility and behavioral patterns of the asset you are trading.
2. Hull Suite
i. Hull Suite Length: Designed for capturing long-term trends, the Hull Suite Length is configured at 1000. Functioning comparably to moving averages, the Hull Suite features upper and lower bands, though these are not employed in our current strategy.
ii. Length Multiplier: It's advisable to maintain a minimal value for the Length Multiplier, prioritizing the optimization of the Hull Suite Length. Presently, it is set to 1.
3. Filtering Indicators
i. Fluctuation Filtering Percentage: It's advisable to set this parameter to ten times the size of the average bar in your specific market, as this helps effectively mitigate the impact of market fluctuations. While the initial default is 0.4(%), based on the BTCUSDT market, it's crucial to adjust this figure to align with the characteristics of different assets or markets you're trading in.
ii. Fluctuation Filtering Bars: This parameter designates the count of preceding bars to consider when assessing market fluctuations. It's fully customizable, allowing you to tailor it based on your market insights. The preset default is 3, a balance chosen to minimize susceptibility to potentially misleading signals.
iii. Trend Confirmation Percentage: This metric is pivotal for verifying the viability of a trend post-entry. If the trade doesn't achieve this percentage in profit, it indicates a deviation from the expected trend. Under such circumstances, it may be prudent to exit the trade prematurely rather than awaiting the stop-loss trigger. It's recommended to set this parameter at half the size of the average candle body for the market you're analyzing. The initial default is set at 0.2(%).
4. StopLoss and TakeProfit
i. StopLoss and TakeProfit Settings: Two distinct approaches are available. Semi-Automatic StopLoss/TakeProfit Setting and Manual StopLoss/TakeProfit Setting. The Semi-Automatic mode streamlines the process by allowing you to input values for a 5-minute timeframe, subsequently auto-adjusting these values across various timeframes, both lower and higher. Conversely, the Manual mode offers full control, enabling you to meticulously define TakeProfit values for each individual timeframe.
ii. TakeProfit Threshold # and TakeProfit Value #: Imagine this mechanism as an ascending staircase. Each step represents a range, with the lower boundary (TakeProfit Value) designed to close the trade upon being reached, and the upper boundary (TakeProfit Threshold) upon being hit, propelling the trade to the next level, and forming a new range. This stair-stepping approach enhances risk management and has the potential to increase profitability. The pre-set configurations are tailored for volatile markets, such as BTCUSDT. It's advisable to devote time to tailoring these settings to your specific market, aiming to achieve optimal results based on backtesting.
iii. StopLoss Value: In line with its name, this value marks the limit of loss you're prepared to accept should the market trend go against your expectations. It's crucial to note that once your asset reaches the first TakeProfit range, the initial StopLoss value becomes obsolete, supplanted by the first TakeProfit Value. The default StopLoss value is pegged at 1.8(%), a figure worth considering in your trading strategy.
VII) Entry Conditions
The principal element that triggers the signal is the Modified Supertrend. Additional indicators serve as confirmatory tools. Nonetheless, to refine your strategy effectively, it's crucial to fine-tune the parameters. This involves adjusting input variables such as take profit levels, threshold parameters, and the filtering values discussed previously.
VIII) Exit Conditions
The strategy stipulates exit conditions primarily governed by stop loss and take profit parameters. On infrequent occasions, if the trend lacks confirmation post-entry, the strategy mandates an exit upon the issuance of a reverse signal (whether confirmed or unconfirmed) by the strategy itself.
Good Luck!!

The Flash-Strategy with Minervini Stage Analysis QualifierThe Flash-Strategy (Momentum-RSI, EMA-crossover, ATR) with Minervini Stage Analysis Qualifier
Introduction
Welcome to a comprehensive guide on a cutting-edge trading strategy I've developed, designed for the modern trader seeking an edge in today's dynamic markets. This strategy, which I've honed through my years of experience in the trading arena, stands out for its unique blend of technical analysis and market intuition, tailored specifically for use on the TradingView platform.
As a trader with a deep passion for the financial markets, my journey began several years ago, driven by a relentless pursuit of a trading methodology that is both effective and adaptable. My background in trading spans various market conditions and asset classes, providing me with a rich tapestry of experiences from which to draw. This strategy is the culmination of that journey, embodying the lessons learned and insights gained along the way.
The cornerstone of this strategy lies in its ability to generate precise long signals in a Stage 2 uptrend and equally accurate short signals in a Stage 4 downtrend. This approach is rooted in the principles of trend following and momentum trading, harnessing the power of key indicators such as the Momentum-RSI, EMA Crossover, and Average True Range (ATR). What sets this strategy apart is its meticulous design, which allows it to adapt to the ever-changing market conditions, providing traders with a robust tool for navigating both bullish and bearish scenarios.
This strategy was born out of a desire to create a trading system that is not only highly effective in identifying potential trade setups but also straightforward enough to be implemented by traders of varying skill levels. It's a reflection of my belief that successful trading hinges on clarity, precision, and disciplined execution. Whether you are a seasoned trader or just beginning your journey, this guide aims to provide you with a comprehensive understanding of how to harness the full potential of this strategy in your trading endeavors.
In the following sections, we will delve deeper into the mechanics of the strategy, its implementation, and how to make the most out of its features. Join me as we explore the nuances of a strategy that is designed to elevate your trading to the next level.
Stage-Specific Signal Generation
A distinctive feature of this trading strategy is its focus on generating long signals exclusively during Stage 2 uptrends and short signals during Stage 4 downtrends. This approach is based on the widely recognized market cycle theory, which divides the market into four stages: Stage 1 (accumulation), Stage 2 (uptrend), Stage 3 (distribution), and Stage 4 (downtrend). By aligning the signal generation with these specific stages, the strategy aims to capitalize on the most dynamic and clear-cut market movements, thereby enhancing the potential for profitable trades.
1. Long Signals in Stage 2 Uptrends
• Characteristics of Stage 2: Stage 2 is characterized by a strong uptrend, where prices are consistently rising. This stage typically follows a period of accumulation (Stage 1) and is marked by increased investor interest and bullish sentiment in the market.
• Criteria for Long Signal Generation: Long signals are generated during this stage when the technical indicators align with the characteristics of a Stage 2 uptrend.
• Rationale for Stage-Specific Signals: By focusing on Stage 2 for long trades, the strategy seeks to enter positions during the phase of strong upward momentum, thus riding the wave of rising prices and investor optimism. This stage-specific approach minimizes exposure to less predictable market phases, like the consolidation in Stage 1 or the indecision in Stage 3.
2. Short Signals in Stage 4 Downtrends
• Characteristics of Stage 4: Stage 4 is identified by a pronounced downtrend, with declining prices indicating prevailing bearish sentiment. This stage typically follows the distribution phase (Stage 3) and is characterized by increasing selling pressure.
• Criteria for Short Signal Generation: Short signals are generated in this stage when the indicators reflect a strong bearish trend.
• Rationale for Stage-Specific Signals: Targeting Stage 4 for shorting capitalizes on the market's downward momentum. This tactic aligns with the natural market cycle, allowing traders to exploit the downward price movements effectively. By doing so, the strategy avoids the potential pitfalls of shorting during the early or late stages of the market cycle, where trends are less defined and more susceptible to reversals.
In conclusion, the strategy’s emphasis on stage-specific signal generation is a testament to its sophisticated understanding of market dynamics. By tailoring the long and short signals to Stages 2 and 4, respectively, it leverages the most compelling phases of the market cycle, offering traders a clear and structured approach to aligning their trades with dominant market trends.
Strategy Overview
At the heart of this trading strategy is a philosophy centered around capturing market momentum and trend efficiency. The core objective is to identify and capitalize on clear uptrends and downtrends, thereby allowing traders to position themselves in sync with the market's prevailing direction. This approach is grounded in the belief that aligning trades with these dominant market forces can lead to more consistent and profitable outcomes.
The strategy is built on three foundational components, each playing a critical role in the decision-making process:
1. Momentum-RSI (Relative Strength Index): The Momentum-RSI is a pivotal element of this strategy. It's an enhanced version of the traditional RSI, fine-tuned to better capture the strength and velocity of market trends. By measuring the speed and change of price movements, the Momentum-RSI provides invaluable insights into whether a market is potentially overbought or oversold, suggesting possible entry and exit points. This indicator is especially effective in filtering out noise and focusing on substantial market moves.
2. EMA (Exponential Moving Average) Crossover: The EMA Crossover is a crucial component for trend identification. This strategy employs two EMAs with different timeframes to determine the market trend. When the shorter-term EMA crosses above the longer-term EMA, it signals an emerging uptrend, suggesting a potential long entry. Conversely, a crossover below indicates a possible downtrend, hinting at a short entry opportunity. This simple yet powerful tool is key in confirming trend directions and timing market entries.
3. ATR (Average True Range): The ATR is instrumental in assessing market volatility. This indicator helps in understanding the average range of price movements over a given period, thus providing a sense of how much a market might move on a typical day. In this strategy, the ATR is used to adjust stop-loss levels and to gauge the potential risk and reward of trades. It allows for more informed decisions by aligning trade management techniques with the current volatility conditions.
The synergy of these three components – the Momentum-RSI, EMA Crossover, and ATR – creates a robust framework for this trading strategy. By combining momentum analysis, trend identification, and volatility assessment, the strategy offers a comprehensive approach to navigating the markets. Whether it's capturing a strong trend in its early stages or identifying a potential reversal, this strategy aims to provide traders with the tools and insights needed to make well-informed, strategically sound trading decisions.
Detailed Component Analysis
The efficacy of this trading strategy hinges on the synergistic functioning of its three key components: the Momentum-RSI, EMA Crossover, and Average True Range (ATR). Each component brings a unique perspective to the strategy, contributing to a well-rounded approach to market analysis.
1. Momentum-RSI (Relative Strength Index)
• Definition and Function: The Momentum-RSI is a modified version of the classic Relative Strength Index. While the traditional RSI measures the velocity and magnitude of directional price movements, the Momentum-RSI amplifies aspects that reflect trend strength and momentum.
• Significance in Identifying Trend Strength: This indicator excels in identifying the strength behind a market's move. A high Momentum-RSI value typically indicates strong bullish momentum, suggesting the potential continuation of an uptrend. Conversely, a low Momentum-RSI value signals strong bearish momentum, possibly indicative of an ongoing downtrend.
• Application in Strategy: In this strategy, the Momentum-RSI is used to gauge the underlying strength of market trends. It helps in filtering out minor fluctuations and focusing on significant movements, providing a clearer picture of the market's true momentum.
2. EMA (Exponential Moving Average) Crossover
• Definition and Function: The EMA Crossover component utilizes two exponential moving averages of different timeframes. Unlike simple moving averages, EMAs give more weight to recent prices, making them more responsive to new information.
• Contribution to Market Direction: The interaction between the short-term and long-term EMAs is key to determining market direction. A crossover of the shorter EMA above the longer EMA is an indicator of an emerging uptrend, while a crossover below signals a developing downtrend.
• Application in Strategy: The EMA Crossover serves as a trend confirmation tool. It provides a clear, visual representation of the market's direction, aiding in the decision-making process for entering long or short positions. This component ensures that trades are aligned with the prevailing market trend, a crucial factor for the success of the strategy.
3. ATR (Average True Range)
• Definition and Function: The ATR is an indicator that measures market volatility by calculating the average range between the high and low prices over a specified period.
• Role in Assessing Market Volatility: The ATR provides insights into the typical market movement within a given timeframe, offering a measure of the market's volatility. Higher ATR values indicate increased volatility, while lower values suggest a calmer market environment.
• Application in Strategy: Within this strategy, the ATR is instrumental in tailoring risk management techniques, particularly in setting stop-loss levels. By accounting for the market's volatility, the ATR ensures that stop-loss orders are placed at levels that are neither too tight (risking premature exits) nor too loose (exposing to excessive risk).
In summary, the combination of Momentum-RSI, EMA Crossover, and ATR in this trading strategy provides a comprehensive toolkit for market analysis. The Momentum-RSI identifies the strength of market trends, the EMA Crossover confirms the market direction, and the ATR guides in risk management by assessing volatility. Together, these components form the backbone of a strategy designed to navigate the complexities of the financial markets effectively.
1. Signal Generation Process
• Combining Indicators: The strategy operates by synthesizing signals from the Momentum-RSI, EMA Crossover, and ATR indicators. Each indicator serves a specific purpose: the Momentum-RSI gauges trend momentum, the EMA Crossover identifies the trend direction, and the ATR assesses the market’s volatility.
• Criteria for Signal Validation: For a signal to be considered valid, it must meet specific criteria set by each of the three indicators. This multi-layered approach ensures that signals are not only based on one aspect of market behavior but are a result of a comprehensive analysis.
2. Conditions for Long Positions
• Uptrend Confirmation: A long position signal is generated when the shorter-term EMA crosses above the longer-term EMA, indicating an uptrend.
• Momentum-RSI Alignment: Alongside the EMA crossover, the Momentum-RSI should indicate strong bullish momentum. This is typically represented by the Momentum-RSI being at a high level, confirming the strength of the uptrend.
• ATR Consideration: The ATR is used to fine-tune the entry point and set an appropriate stop-loss level. In a low volatility scenario, as indicated by the ATR, the stop-loss can be set tighter, closer to the entry point.
3. Conditions for Short Positions
• Downtrend Confirmation: Conversely, a short position signal is indicated when the shorter-term EMA crosses below the longer-term EMA, signaling a downtrend.
• Momentum-RSI Confirmation: The Momentum-RSI should reflect strong bearish momentum, usually seen when the Momentum-RSI is at a low level. This confirms the bearish strength of the market.
• ATR Application: The ATR again plays a role in determining the stop-loss level for the short position. Higher volatility, as indicated by a higher ATR, would warrant a wider stop-loss to accommodate larger market swings.
By adhering to these mechanics, the strategy aims to ensure that each trade is entered with a high probability of success, aligning with the market’s current momentum and trend. The integration of these indicators allows for a holistic market analysis, providing traders with clear and actionable signals for both entering and exiting trades.
Customizable Parameters in the Strategy
Flexibility and adaptability are key features of this trading strategy, achieved through a range of customizable parameters. These parameters allow traders to tailor the strategy to their individual trading style, risk tolerance, and specific market conditions. By adjusting these parameters, users can fine-tune the strategy to optimize its performance and align it with their unique trading objectives. Below are the primary parameters that can be customized within the strategy:
1. Momentum-RSI Settings
• Period: The lookback period for the Momentum-RSI can be adjusted. A shorter period makes the indicator more sensitive to recent price changes, while a longer period smoothens the RSI line, offering a broader view of the momentum.
• Overbought/Oversold Thresholds: Users can set their own overbought and oversold levels, which can help in identifying extreme market conditions more precisely according to their trading approach.
2. EMA Crossover Settings
• Timeframes for EMAs: The strategy uses two EMAs with different timeframes. Traders can modify these timeframes, choosing shorter periods for a more responsive approach or longer periods for a more conservative one.
• Source Data: The choice of price data (close, open, high, low) used in calculating the EMAs can be varied depending on the trader’s preference.
3. ATR Settings
• Lookback Period: Adjusting the lookback period for the ATR impacts how the indicator measures volatility. A longer period may provide a more stable but less responsive measure, while a shorter period offers quicker but potentially more erratic readings.
• Multiplier for Stop-Loss Calculation: This parameter allows traders to set how aggressively or conservatively they want their stop-loss to be in relation to the ATR value.
Here are the standard settings:

YinYang RSI Volume Trend StrategyThere are many strategies that use RSI or Volume but very few that take advantage of how useful and important the two of them combined are. This strategy uses the Highs and Lows with Volume and RSI weighted calculations on top of them. You may be wondering how much of an impact Volume and RSI can have on the prices; the answer is a lot and we will discuss those with plenty of examples below, but first…
How does this strategy work?
It’s simple really, when the purchase source crosses above the inner low band (red) it creates a Buy or Long. This long has a Trailing Stop Loss band (the outer low band that's also red) that can be adjusted in the Settings. The Stop Loss is based on a % of the inner low band’s price and by default it is 0.1% lower than the inner band’s price. This Stop Loss is not only a stop loss but it can also act as a Purchase Available location.
You can get back into a trade after a stop loss / take profit has been hit when your Reset Purchase Availability After condition has been met. This can either be at Stop Loss, Entry or None.
It is advised to allow it to reset in case the stop loss was a fake out but the call was right. Sometimes it may trigger stop loss multiple times in a row, but you don’t lose much on stop loss and you gain lots when the call is right.
The Take Profit location is the basis line (white). Take Profit occurs when the Exit Source (close, open, high, low or other) crosses the basis line and then on a different bar the Exit Source crosses back over the basis line. For example, if it was a Long and the bar’s Exit Source closed above the basis line, and then 2 bars later its Exit Source closed below the basis line, Take Profit would occur. You can disable Take Profit in Settings, but it is very useful as many times the price will cross the Basis and then correct back rather than making it all the way to the opposing zone.
Longs:
If for instance your Long doesn’t need to Take Profit and instead reaches the top zone, it will close the position when it crosses above the inner top line (green).
Please note you can change the Exit Source too which is what source (close, open, high, low) it uses to end the trades.
The Shorts work the same way as the Long but just opposite, they start when the purchase source crosses under the inner upper band (green).
Shorts:
Shorts take profit when it crosses under the basis line and then crosses back.
Shorts will Stop loss when their outer upper band (green) is crossed with the Exit Source.
Short trades are completed and closed when its Exit Source crosses under the inner low red band.
So, now that you understand how the strategy works, let’s discuss why this strategy works and how it is profitable.
First we will discuss Volume as we deem it plays a much bigger role overall and in our strategy:
As I’m sure many of you know, Volume plays a huge factor in how much something moves, but it also plays a role in the strength of the movement. For instance, let’s look at two scenarios:
Bitcoin’s price goes up $1000 in 1 Day but the Volume was only 10 million
Bitcoin’s price goes up $200 in 1 Day but the Volume was 40 million
If you were to only look at the price, you’d say #1 was more important because the price moved x5 the amount as #2, but once you factor in the volume, you know this is not true. The reason why Volume plays such a huge role in Price movement is because it shows there is a large Limit Order battle going on. It means that both Bears and Bulls believe that price is a good time to Buy and Sell. This creates a strong Support and Resistance price point in this location. If we look at scenario #2, when there is high volume, especially if it is drastically larger than the average volume Bitcoin was displaying recently, what can we decipher from this? Well, the biggest take away is that the Bull’s won the battle, and that likely when that happens we will see bullish movement continuing to happen as most of the Bears Limit Orders have been fulfilled. Whereas with #2, when large price movement happens and Bitcoin goes up $1000 with low volume what can we deduce? The main takeaway is that Bull’s pressured the price up with Market Orders where they purchased the best available price, also what this means is there were very few people who were wanting to sell. This generally dictates that Whale Limit orders for Sells/Shorts are much higher up and theres room for movement, but it also means there is likely a whale that is ready to dump and crash it back down.
You may be wondering, what did this example have to do with YinYang RSI Volume Trend Strategy? Well the reason we’ve discussed this is because we use Volume multiple times to apply multiplications in our calculations to add large weight to the price when there is lots of volume (this is applied both positively and negatively). For instance, if the price drops a little and there is high volume, our strategy will move its bounds MUCH lower than the price actually dropped, and if there was low volume but the price dropped A LOT, our strategy will only move its bounds a little. We believe this reflects higher levels of price accuracy than just price alone based on the examples described above.
Don’t believe us?
Here is with Volume NOT factored in (VWMA = SMA and we remove our Volume Filter calculation):
Which produced -$2880 Profit
Here is with our Volume factored in:
Which produced $553,000 (55.3%)
As you can see, we wen’t from $-2800 profit with volume not factored to $553,000 with volume factored. That's quite a big difference! (Please note previous success does not predict future success we are simply displaying the $ amounts as example).
Now how about RSI and why does it matter in this strategy?
As I’m sure most of you are aware, RSI is one of the leading indicators used in trading. For this reason we figured it would only make sense to incorporate it into our calculations. We fiddled with RSI for quite awhile and sometimes what logically seems to be the right way to use it isn’t. Now, because of this, our RSI calculation is a little odd, but basically what we’re doing is we calculate the RSI, then turn it into a percentage (between 0-1) that can easily be multiplied to the price point we need. The price point we use is the difference between our high purchase zone and our low purchase zone. This allows us to see how much price movement there is between zones. We multiply our zone size with our RSI multiplication and we get the amount we will add +/- to our basis line (white line). This officially creates the NEW high and low purchase zones that we are actually using and displaying in our trades.
If you found that confusing, here are some examples to why it is an important calculation for this strategy:
Before RSI factored in:
Which produced 27.8% Profit
After RSI factored in:
Which produced 553% Profit
As you can see, the RSI makes not only the purchase zones more accurate, but it also greatly increases the profit the strategy is able to make. It also helps ensure an relatively linear profit slope so you know it is reliable with its trades.
This strategy can work on pretty much anything, but you should tweak the values a bit for each pair you are trading it with for best results.
We hope you can find some use out of this simple but effective strategy, if you have any questions, comments or concerns please let us know.
HAPPY TRADING!

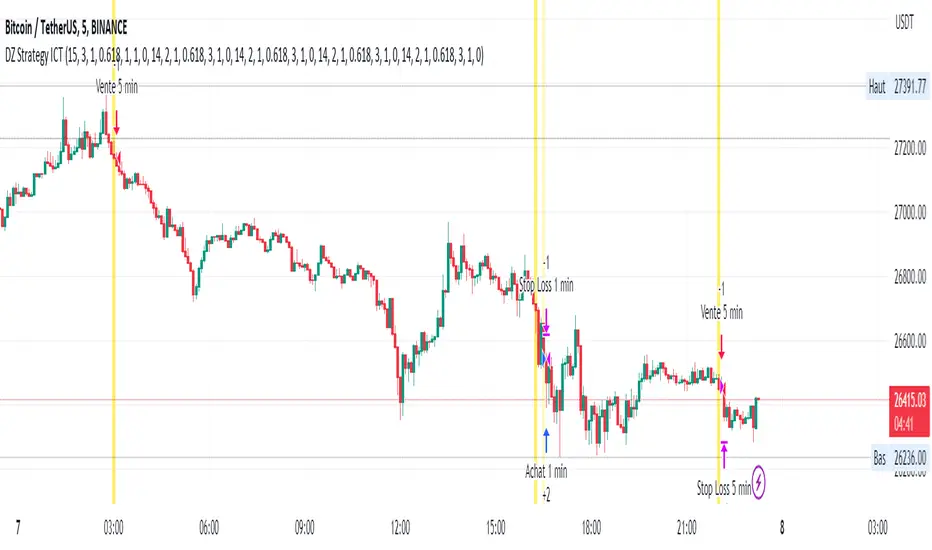
DZ Strategy ICTThe script presented is a trading strategy called "Breaker Block Strategy with Price Channel". This strategy uses multiple time frames (1 minute, 5 minutes, 15 minutes, 1 hour, and 4 hours) to detect support and resistance areas on the chart.
The strategy uses parameters such as length, deviations, multiplier, Fibonacci level, move lag and volume threshold for each time frame. These parameters are adjustable by the user.
The script then calculates support and resistance levels using the simple moving average (SMA) and standard deviation (STDEV) of closing prices for each time frame.
It also detects "Breaker Blocks" based on price movement from support and resistance levels, as well as trade volume. A Breaker Block occurs when there is a significant breakout of a support or resistance level with high volume.
Buy and sell signals are generated based on the presence of a Breaker Block and price movement from support and resistance levels. When a buy signal is generated, a buy order is placed, and when a sell signal is generated, a sell order is placed.
The script also plots price channels for each time frame, representing resistance and support levels.
Profit limit levels are set for each time range, indicating that the price levels assigned to positions should be closed with a profit. Stop-loss levels are also set to limit losses in the event of canceled price movements.
In summary, this trading strategy uses a combination of Breaker Block detection, support and resistance levels, price channels and profit limit levels to generate buy and sell signals and manage positions on different time ranges.
Premium MTF Layered RSI - Bitcoin Bot [wbburgin]This the premium version of my MTF Layered RSI strategy, which improves significantly on the original strategy (publicly available on my profile). Improvements are below. This strategy will also appear as an overlay on your chart. It is completely non-repainting.
The MTF Layered RSI strategy uses the current timeframe and two configurable higher timeframes to enter a long position when Bitcoin is oversold on all three timeframes, and exit the long position when Bitcoin is overbought on the current timeframe. This hedges against situations where the RSI on higher timeframes never reaches the overbought level and we are left "holding the bag" so to speak with the classic "enter long at oversold and enter short at overbought" strategy.
IMPORTANT: This strategy does not work on ranges. It will work on all timeframes and assets, but does not work on ranges (Renko blocks and some other advanced types of charts).
********** My Background
I am an investor, trader, and entrepreneur with 10 years of cryptocurrency and equity trading experience and founder of two fintech startups. I am a graduate of a prestigious university in the United States and carry broad and inclusive interests in mathematical finance, computer science, machine learning / artificial intelligence, as well as other fields.
**********
Improvements over the original MTF RSI strategy include:
Filters for Uptrends and Downtrends → The Premium RSI strategy will adjust its buy and sell thresholds depending on whether the instrument is trending. This means that, in uptrends, the Premium strategy will buy more frequently, bringing in potentially greater profit, and in downtrends, the strategy will stop buying altogether. These filters and dynamic buy/sell thresholds have made this strategy more profitable in my backtesting across random timeframes, but I cannot guarantee that the strategy will be profitable for you on the default settings. To that end, I have enabled a number of different configurations that you can change in the settings of the strategy.
Stop Loss / Take Profit Calculation Per Tick → Stop loss and take profit are now both enabled in the script and each has their own alerts. You can specify what type of stop loss or take profit you want: percentage or ATR. If you have alerts configured, you will be alerted mid-bar, instead of at close. This helps prevent loss from abrupt falls in price between closing price and next bar open.
Customizable Alert Messages In-Strategy → In the settings, there will be text boxes where you can create your own alerts. All you will need to do is create an alert in the alert panel on Tradingview and leave the message box blank - if you fill out the alert boxes in the settings, these will automatically populate into your alerts. There are in total eight different customizable alerts messages: Entry, Exit, Stop loss, and Take profit alerts for both Long and Short sides. If you disable stop loss and/or take profit, these alerts will also be disabled. Similarly, if you disable shorts, all short alerts will be disabled.
**********
Display
Configuring Stop Loss or Take Profit will make their corresponding displays appear.
Separately from the trading boxes, background colors (green, red) signify extended uptrends and downtrends, respectively.
Configuring Alerts
In TradingView desktop, go to the ‘Alerts’ tab on the right panel. Click the “+” button to create a new alert. Select this strategy for the condition and one of the two options that includes alert() function calls. Name the alert what you wish and clear the default message, because your text in the settings will replace this message.
Now that the alert is configured, you can go to the settings of the strategy and fill in your chosen text for the specific alert condition. You will need to check “Long and Short” in the “Trade Direction” setting in order for any Short Alerts to become active. Similarly, you will need to check “Enable Stop Loss” for stop loss alerts to become active and “Enable Take Profit” for take profit alerts to become active.
**********
Disclaimer
Copyright by wbburgin.
The information contained in my Scripts/Indicators/Algorithms does not constitute financial advice or a solicitation to buy or sell any securities of any type. I will not accept liability for any loss or damage, including without limitation any loss of profit, which may arise directly or indirectly from the use of or reliance on such information.
All investments involve risk, and the past performance of a security, industry, sector, market, financial product, trading strategy, backtest, or individual's trading does not guarantee future results or returns. Investors are fully responsible for any investment decisions they make. Such decisions should be based solely on an evaluation of their financial circumstances, investment objectives, risk tolerance, and liquidity needs.
**********
Notes on the Strategy Performance below: This is 3% of equity per trade, with a pyramiding number of 3. I did not include fees because Binance US on Bitcoin/USD does not charge fees on the instrument; however, I heavily encourage you to include fees in your backtesting if you use a different brokerage. To mitigate fees, this strategy is designed with a high average %/trade. If your current fees are greater than the strategy's average %/trade, I encourage you to choose a higher RSI period, such as 14 or 28, which will result in less trades but potentially a higher %/trade.

FVG Strategy - Fair Value GapThe Fair Value Gap Strategy (FVG) is a trading approach that relies on price action analysis and involves identifying market inefficiencies or imbalances.
The strategy offers a variety of customizable settings to match your preferences and includes an entry and exit strategy to guide you through trades.
The script operates in the following manner:
It begins by searching for fair-value-gaps and subsequently identifies a break in structure.
The next step involves waiting for the price to retrace within the previously established fair value gap.
Within this gap, there is a Fibonacci retracement that must be reached before placing a stop-order.
Example: GER40, 1min Chart
STOP LOSS & RISK MANAGEMENT
FVG : The stop loss will be set at the end of the fair value gap
Last Swing : The stop loss will be at the last swing high/low
ATR (Average True Range) : The stop loss will be placed one 'Average True Range' away from the entry
TAKE PROFIT
Pips/Points : The stop loss will be set at the chosen amount of pips/points.
RiskReward TP : This is a fixed take profit where you can set a specific risk-to-reward ratio for the trade. For example, you can set a 1:3 risk-to-reward ratio.
Trailing Stop : This is a flexible stop that moves with the market price, allowing you to capture more profit as the trade moves in your favor.
Both : This option combines both the RiskReward TP and Trailing Stop. If the price target is set at a 1:3 risk-to-reward ratio, the trailing stop will move with the price until either the stop or take profit is reached, and the position will be closed completely.
THE FVG SECTION
In the FVG section, you will have the ability to customize your settings based on your specific requirements.
Firstly, you will have the choice of two possible entry options:
Candle Close : This option triggers the order once the candle has completely closed and all the set requirements are met.
Stop Orders : This option triggers the order once all the set requirements are met, even if the candle is still active and has not yet closed.
On top, you can activate the "Pinbar-Trading", that will allow you to take a trade on a pinbar, even when the candle just dipped into the FVG and snapped back.
FAIR VALUE GAP TYPE
On volatile market, it may happen that a massive FVG is created. Thats why we have separated the FVG into 2 different variables.
FVG Type: Normal : This is all regular FVG that meet the requirement of you minimum size range. As example FVG must be minimum 5$ big.
FVG Type: Big : This are all big FVG that meet the minimum set size range. The difference to the "normal" type, the stop loss will be set at 50% of the Big-FVG.
FIBONACCI RETRACEMENT & MARKET STRUCTURE
To refine the FVG strategy, you have three options:
Fibonacci Retracement Value (%) : The FVG strategy employs a Fibonacci retracement, which allows you to trade in the direction of the market movement. To initiate the order, the price must reach a predetermined Fibonacci level and then rebound.
Formation-to-Retracement Countdown: : This option provides you with a specified number of candles to meet the necessary conditions. For example, if the order is not triggered within 20 candles, delete the FVG-Zone and skip the trade to avoid getting caught in a sideways ranging trend.
Structure Lookback : This feature filters out older FVG Zones. You can specify the number of candles that should mark the FVG Zones. Keep in mind that newer and fresher zones will automatically conceal older ones.
Lorentzian Classification Strategy Based in the model of Machine learning: Lorentzian Classification by @jdehorty, you will be able to get into trending moves and get interesting entries in the market with this strategy. I also put some new features for better backtesting results!
Backtesting context: 2022-07-19 to 2023-04-14 of US500 1H by PEPPERSTONE. Commissions: 0.03% for each entry, 0.03% for each exit. Risk per trade: 2.5% of the total account
For this strategy, 3 indicators are used:
Machine learning: Lorentzian Classification by @jdehorty
One Ema of 200 periods for identifying the trend
Supertrend indicator as a filter for some exits
Atr stop loss from Gatherio
Trade conditions:
For longs:
Close price is above 200 Ema
Lorentzian Classification indicates a buying signal
This gives us our long signal. Stop loss will be determined by atr stop loss (white point), break even(blue point) by a risk/reward ratio of 1:1 and take profit of 3:1 where half position will be closed. This will be showed as buy.
The other half will be closed when the model indicates a selling signal or Supertrend indicator gives a bearish signal. This will be showed as cl buy.
For shorts:
Close price is under 200 Ema
Lorentzian Classification indicates a selling signal
This gives us our short signal. Stop loss will be determined by atr stop loss (white point), break even(blue point) by a risk/reward ratio of 1:1 and take profit of 3:1 where half position will be closed. This will be showed as sell.
The other half will be closed when the model indicates a buying signal or Supertrend indicator gives a bullish signal. This will be showed as cl sell.
Risk management
To calculate the amount of the position you will use just a small percent of your initial capital for the strategy and you will use the atr stop loss or last swing for this.
Example: You have 1000 usd and you just want to risk 2,5% of your account, there is a buy signal at price of 4,000 usd. The stop loss price from atr stop loss or last swing is 3,900. You calculate the distance in percent between 4,000 and 3,900. In this case, that distance would be of 2.50%. Then, you calculate your position by this way: (initial or current capital * risk per trade of your account) / (stop loss distance).
Using these values on the formula: (1000*2,5%)/(2,5%) = 1000usd. It means, you have to use 1000 usd for risking 2.5% of your account.
We will use this risk management for applying compound interest.
> In settings, with position amount calculator, you can enter the amount in usd of your account and the amount in percentage for risking per trade of the account. You will see this value in green color in the upper left corner that shows the amount in usd to use for risking the specific percentage of your account.
> You can also choose a fixed amount, so you will have to activate fixed amount in risk management for trades and set the fixed amount for backtesting.
Script functions
Inside of settings, you will find some utilities for display atr stop loss, break evens, positions, signals, indicators, a table of some stats from backtesting, etc.
You will find the settings for risk management at the end of the script if you want to change something or trying new values for other assets for backtesting.
If you want to change the initial capital for backtest the strategy, go to properties, and also enter the commisions of your exchange and slippage for more realistic results.
In risk managment you can find an option called "Use leverage ?", activate this if you want to backtest using leverage, which means that in case of not having enough money for risking the % determined by you of your account using your initial capital, you will use leverage for using the enough amount for risking that % of your acount in a buy position. Otherwise, the amount will be limited by your initial/current capital
I also added a function for backtesting if you had added or withdrawn money frequently:
Adding money: You can choose how often you want to add money (Monthly, yearly, daily or weekly). Then a fixed amount of money and activate or deactivate this function
Withdraw money: You can choose if you want to withdraw a fixed amount or a percentage of earnings. Then you can choose a fixed amount of money, the period of time and activate or deactivate this function. Also, the percentage of earnings if you choosed this option.
Some other assets where strategy has worked
BTCUSD 4H, 1D
ETHUSD 4H, 1D
BNBUSD 4H
SPX 1D
BANKNIFTY 4H, 15 min
Some things to consider
USE UNDER YOUR OWN RISK. PAST RESULTS DO NOT REPRESENT THE FUTURE.
DEPENDING OF % ACCOUNT RISK PER TRADE, YOU COULD REQUIRE LEVERAGE FOR OPEN SOME POSITIONS, SO PLEASE, BE CAREFULL AND USE CORRECTLY THE RISK MANAGEMENT
Do not forget to change commissions and other parameters related with back testing results!. If you have problems loading the script reduce max bars back number in general settings
Strategies for trending markets use to have more looses than wins and it takes a long time to get profits, so do not forget to be patient and consistent !
Please, visit the post from @jdehorty called Machine Learning: Lorentzian Classification for a better understanding of his script!
Any support and boosts will be well received. If you have any question, do not doubt to ask!

Strategy for UT Bot Alerts indicator Using the UT Bot alerts indicator by @QuantNomad, this strategy was designed for showing an example of how this indicator could be used, also, it has the goal to help some people from a group that use to use this indicator for their trading. Under any circumstance I recommend to use it without testing it before in real time.
Backtesting context: 2020-02-05 to 2023-02-25 of BTCUSD 4H by Tvc. Commissions: 0.03% for each entry, 0.03% for each exit. Risk per trade: 2.5% of the total account
For this strategy, 3 indicators are used:
UT Bot Alerts indicator by Quantnomad
One Ema of 200 periods for indicate the trend
Atr stop loss from Gatherio
Trade conditions:
For longs:
Close price is higher than Atr from UT Bot
Ema from UT Bot cross over Atr from UT Bot.
This gives us our long signal. Stop loss will be determined by atr stop loss (white point), break even(blue point) by a risk/reward ratio of 0.75:1 and take profit of 3:1 where half position will be closed. This will be showed as buy (open long position)
The other half will be closed when close price is lower than Atr and Ema from UT Bot cross under Atr. This will be showed as cl buy (close long position)
For shorts:
Close price is lower than Atr from UT Bot
Ema from UT Bot cross over Atr from UT Bot.
This gives us our short signal. Stop loss will be determined by atr stop loss (white point), break even(blue point) by a risk/reward ratio of 0.75:1 and take profit of 3:1 where half position will be closed. This will be showed as sell (open short position)
The other half will be closed when close price is higher than Atr and Ema from UT Bot cross over Atr. This will be showed as cl sell (close short position)
Risk management
For calculate the amount of the position you will use just a small percent of your initial capital for the strategy and you will use the atr stop loss for this.
Example: You have 1000 usd and you just want to risk 2,5% of your account, there is a long signal at price of 20,000 usd. The stop loss price from atr stop loss is 19,000. You calculate the distance in percent between 20,000 and 19,000. In this case, that distance would be of 5,0%. Then, you calculate your position by this way: (initial or current capital * risk per trade of your account) / (stop loss distance).
Using these values on the formula: (1000*2,5%)/(5,0%) = 500usd. It means, you have to use 500 usd for risking 2.5% of your account.
We will use this risk management for apply compound interest.
In settings, with position amount calculator, you can enter the amount in usd of your account and the amount in percentage for risking per trade of the account. You will see this value in green color in the upper left corner that shows the amount in usd to use for risking the specific percentage of your account.
Script functions
Inside of settings, you will find some utilities for display atr stop loss, break evens, positions, signals, indicators, etc.
You will find the settings for risk management at the end of the script if you want to change something. But rebember, do not change values from indicators, the idea is to not over optimize the strategy.
If you want to change the initial capital for backtest the strategy, go to properties, and also enter the commisions of your exchange and slippage for more realistic results.
In risk managment you can find an option called "Use leverage ?", activate this if you want to backtest using leverage, which means that in case of not having enough money for risking the % determined by you of your account using your initial capital, you will use leverage for using the enough amount for risking that % of your acount in a buy position. Otherwise, the amount will be limited by your initial/current capital
---> Do not forget to deactivate Trades on chart option in style settings for a cleaner look of the chart <---
Some things to consider
USE UNDER YOUR OWN RISK. PAST RESULTS DO NOT REPRESENT THE FUTURE.
DEPENDING OF % ACCOUNT RISK PER TRADE, YOU COULD REQUIRE LEVERAGE FOR OPEN SOME POSITIONS, SO PLEASE, BE CAREFULL AND USE CORRECTLY THE RISK MANAGEMENT
Do not forget to change commissions and other parameters related with back testing results!
Strategies for trending markets use to have more looses than wins and it takes a long time to get profits, so do not forget to be patient and consistent !
---> The strategy can still be improved, you can change some parameters depending of the asset and timeframe like risk/reward for taking profits, for break even, also the main parameters of the UT Bot Alerts <----

[1H] Auto SignalMakerBINANCE:SANDUSDT
this strategy is Squeeze Momentum strategy is the on base.
And we added custom ma filter and risk management method. this is not repaint.
This strategy is a long-term strategy.
Use stop loss and profit.
All trading involves high risk; past performance is not necessarily indicative of future results. Hypothetical or simulated performance results have certain inherent limitations.
Unlike an actual performance record, simulated results do not represent actual trading.
Also, since the trades have not actually been executed, the results may have under- or over-compensated for the impact, if any, of certain market factors, such as lack of liquidity.
Simulated trading programs in general are also subject to the fact that they are designed with the benefit of hindsight.
No representation is being made that any account will or is likely to achieve profits or losses similar to those shown.
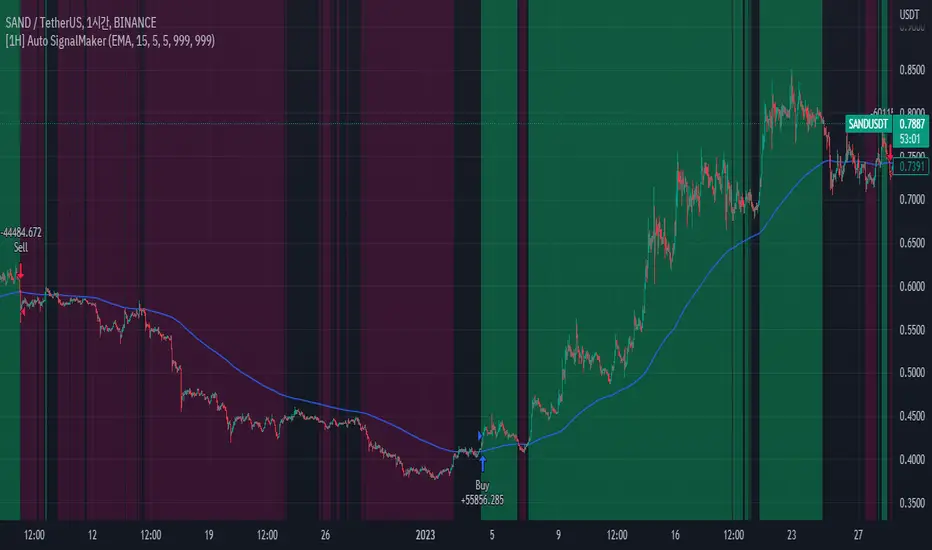
Strategy Myth-Busting #13 - MultiEMA+BXTrender - [SP/MYN]#13 on the Myth-Busting bench, we are automating the "I Found The Highest Win Rate 15 Minute Scalping Trading Strategy Ever" strategy from "TradeIQ" who claims to have backtested this manually and achieved 410% profit over 100 trades within 6 months on Natural Gas with 79 Wins / 21 Losses with an astounding 3.96% Max Drawdown.
It was quite challenging emulating the same subjective EMA pullback logic along with the dependent sequencing of events necessary to enter a trade and we might improve on this to make it better in the future. Super kudos to @spdoinkal who helped with this strategy. If you have ideas on how this could be improved on, would love to hear about them.
As is, we were unable to substantiate similar results to what was manually backtested by TradeIQ, we do however see potential here. Given some optimizations and improvements to the the entry logic accommodating for a wider more variable margin after pullbacks reestablish above/below the fast EMA we think the performance of this strategy could certainly be improved upon. So not sure if we have totally myth busted this completely at this point in time.
This strategy uses a combination of 2 open-source public indicators:
3 EMA's (Trading View Internal)
B-Xtrender by Puppytherapy
Three separate (21), (89) and (200) EMA's are used as a means to confirm and keep entry out of ranged markets. When the 3 EMA's are all clumped up together with no distance it's indicative of a flat or ranged market. This is then used in conjunction with B-XTrender as a means to detect the trend direction. B-XTrender which is a trend following indicator originally published in the IFTA Journal by Bharat Jhunjhunwala. It uses both a short and long term lengths along with a compound EMA used as a means to smooth and sample trend direction.
Trading Rules
15 min candles but other lower time-frames
Stop Loss on previous swing high/low
No Take Profit, Exit on new red/green circles from BX-Trender
Long
EMA Green (21) on top, White (89)in middle and red (200) on bottom and there is distance between EMA's need to be spaced, otherwise in a ranged market
Price action must pull back into 89 EMA (White line) either close or touching it.
Once pullback occurs wait for BX Trender to issue a new green circle and BX Trend line must be green and above 0
Price action must also pull up back above the (Green Line) EMA 21
Short
EMA Red (200) on top, White (89) in middle and Green (21) on bottom and there is distance between EMA's need to be spaced, otherwise in a ranged market
Price action must pull back into 89 EMA (White line) either close or touching it.
Once pullback occurs wait for BX Trender to issue a new red circle and BX Trend line must be red and below 0
Price action must also pull up back below the (green Line) EMA 21
If you know of or have a strategy you want to see myth-busted or just have an idea for one, please feel free to message me.

ichimoku Masters Backtester LightThis Indicator has so many options for build your own strategy
With this indicator you can build your own strategy using the options that we provided here
in the "Static Enter" Section you can choose where do you want to enter your position and customize it with "Enter Candle" Section,by specifying these options, the indicator will start opening the position for you and show you the backtest.
In the "Static Exit (SL & TP)" section you can choose where do you want to exit your positions with setting target and stop for your positions.
And at the end you can set alert on opening and closing position and be aware of that
We hope that you enjoy using ichimoku Masters Backtester Light
-Notice : The Sections: "Dynamic Enter" , "Dynamic Exit" , "9Br Enter" , "9Br Exit" , "Pre Cross" , "Cross Enter" , "Cross Exit" , "Chiko Enter" , "Break Enter" , "Pre Switch" , "Switch Enter" , "Switch Exit" , "Ichi Elements" , "Ichi Elements Order" and "Risk Management" are limited on this version and you are not able to use them
- the "Name" Argument is for naming your strategy
- Open Section has 3 options :
1 : Buy/Sell opens positions when ichimoku cloud and conversion and base line cross at the sametime
2 : 26BoxBr opens position when candle breaks the ichimoku 26 box that indicator builds on "Box" Section
3 : 52BoxBr opens position when candle breaks the ichimoku 52 box that indicator builds on "Box" Section
- Box Section has 6 options :
1 : Cr sets the box on conversion and base cross
2 : OldCr sets the box on conversion and base cross with the beginning candle
3 : PC sets the box on a cross which has no cross before until 26 candles
4 : 9Signal Box sets the box on 9 candles of open position candle
5 : 26Signal Box sets the box on 26 candles of open position candle
4 : 52Signal Box sets the box on 52 candles of open position candle
- Enter1% sets the percent of entry position
- Risk% sets the percent you want to risk your equity
- Max Leverage sets the maximum leverage you want to have on your positions
- S2S is for staying on the position and the indicator does not open the opposite position
- Enter Candle Section has 14 check boxes:
1 : Scandle means that our open position candle should be standard
2 : NoScandle means that our open position candle should not be standard
3 : Tr means that our open position candle should be green for long positions and red for short positions
4 : NoTr means that our open position candle should be red for long positions and green for short positions
5 : G means that our open position candle should be big candle
6 : NoG means that our open position candle should not be big candle
7 : 9Grd means that conversion line shoud be yellow for long positions and white for short positions
8 : No9Grd means that conversion line shoud not be yellow for long positions and white for short positions
9 : 26Grd means that base line shoud be yellow for long positions and white for short positions
10 : No26Grd means that base line shoud not be yellow for long positions and white for short positions
11 : 52Grd means that Lead2 line shoud be yellow for long positions and white for short positions
12 : No52Grd means that Lead2 line shoud not be yellow for long positions and white for short positions
13 : InCL means that our open position candle should be in ichimoku cloud
14 : OutCL means that our open position candle should not be in ichimoku cloud
- Static Exit (SL & TP)
- Sl Section has 6 Options:
1 : Middle26 sets the stop loss of the position on the middle of the box
2 : 9 Stop sets the stop loss of the position on the 9 candles box
3 : 26 Stop sets the stop loss of the position on the 26 candles box
4 : 52 Stop sets the stop loss of the position on the 52 candles box
5 : 26Double box sets the stop loss of the position on the Double of 26 candles box
6 : 52Double box sets the stop loss of the position on the Double of 52 candles box
- in TP we can set our targets from 1 to 20
- LogTp sets our target based on logarithm
- Multiple Enter:
in this section we can set our additional orders for open positions,for this you should turn on the "On" button and then set your orders base on box, for example:
when you put 50 on Enter2 and 10 on Enter2% ,then indicator sets an order on the 50 percent of box in 10% of your equity
- Multiple Exit:
in this section you can set your step exit of order, for this you should turn on the "on" button and set your steps on box targets, for example:
when you put 1 on Exit1 and 10 on Exit1% , then indicator exit 10 percent of your position on the target 1 of box
- RF Stands for risk free and you can risk free your positions using RF ,for example :
when you put 1 on RF and 10 on RF% ,then indicator place your stop on opening position candle when it touches the target 1 of the box and exits 10 percent of your position
- Ichi Numbers : in this section you can specify your ichimoku numbers
- C stands for Conv
- B stands for Base
- L stands for Lead2
- Visual Setting : in this section you can choose variable that you want to see on the chart
- Long TP/SL shows you the Long position target and stop
- Short TP/SL shows you the Short position target and stop
- Cloud shows you the ichimoku cloud
- Offset shifts the ichimoku clouds on 26 candles
- Conv shows you the conversion line
- Base shows you the base line
- Chiko shows you the chiko span line
- Pre shows you the point that conv prediction line and base prediction line cross each other and lead2 prediction line and lead1 prediction line cross too at the same time
- Cr shows you the cross point of conv and base lines
- PC shows the cross point of conv and base lines which has no cross up to 26 candles ago
- EqCr shows you the cross point of conv and base lines which the conv and base are equal
- Buy_Sell shows you the point that conv line and base line cross each other and lead2 line and lead1 line cross too at the same time
- Position Info shows you the information of position such as leverage and entry equity
- Enjoy :)
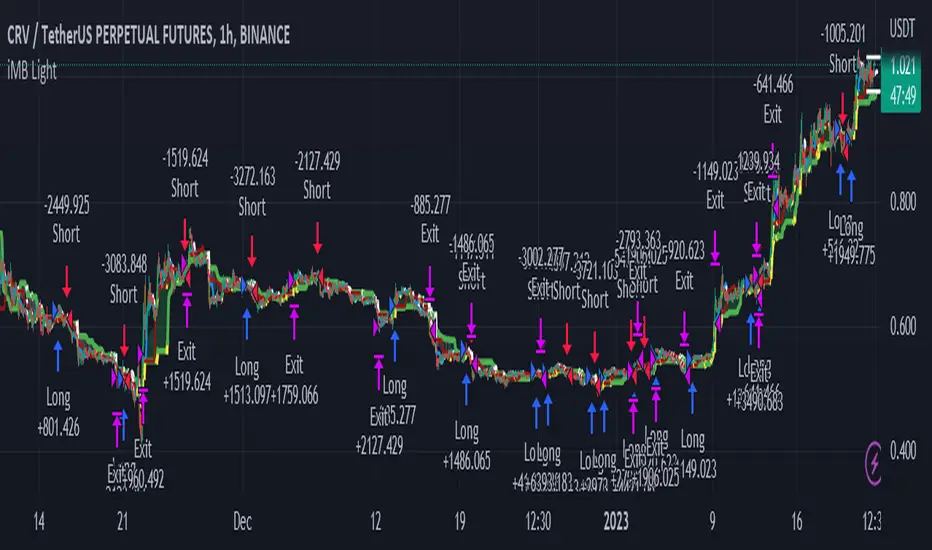
MACD Optimizer Pro [Kioseff Trading]Massive update! This script now includes 12 different moving averages and 30+ built-in technical indicators to enhance your trading strategy optimization! (:
This script (MACD Optimizer Pro) allows the user to optimize and test hundreds of MACD strategies, simultaneously, in under 40 seconds. Of course, theoretically, an unlimited number of trading strategies can be tested with the MACD Optimizer Pro. After the optimization period - the MACD Optimizer Pro will show the most profitable MACD strategy or, should you choose, the highest win-rate MACD strategy or the most-efficient MACD strategy!
Optimization results can be backtested and verified using the native TradingView backtester - which is included in the MACD Optimizer Pro - and made easy to use! This feature makes settings alerts a simple practice!
Features
Test hundreds of MACD strategies, simultaneously, in under 40 seconds.
Optimize long MACD strategies and short MACD strategies.
12 different built-in moving averages included to improve your MACD strategy.
30+ built-in technical indicators to improve your MACD strategy.
Runs as a strategy script - profit factor, PnL , win-rate, number of trades, max drawdown, equity curve and other pertinent statistics shown.
Alerts
Optimize any MACD setting
Profit targets, trailing stops, fixed stop losses, and a binary MACD strategy can all be tested.
Strategies can be optimized for highest win rate, highest net profit, most efficient profit.
Limit orders can be simulated.
External indicators can be used for optimization i.e. your own, custom-built indicator, an indicator from your favorite author, or almost any publicly available
TradingView indicator.
Date range for optimization and backtesting are configurable.
Explanation
The image above shows a list of configurations for the optimizer. You can
You can test hundreds of different MACD settings in under 40 seconds on any timeframe, asset, etc.
The image above shows additional settings to filter the outcome of your optimization testing. Additionally, you can test an unlimited number of profit targets and stop losses!
You can add one of several built-in TradingView indicators to filter trade entries.
The image above shows all built-in moving averages and TradingView indicators that can be incorporated into your MACD strategy.
Additionally, you can add your own, custom indicator to the optimization test, your favorite indicator by your favorite author or almost any publicly available indicator on TradingView.
The image above shows the settings section in which you can implement this feature.
The image above shows an example of the custom indicator feature! In this instance, I am using the public indicator titled "Self-Optimizing" RSI and requiring it to measure below a level prior to entry! Almost any custom indicator, your favorite indicator, etc. is compatible with this feature!
The MACD Optimizer has improved user friendliness over previous versions. The optimizer can be as simple or complex as you'd like - capable of handling both "easy" and "difficult" tasks at your discretion.
Additionally, you can configure the optimizer to prioritize MACD strategies that earn profit most efficiently!
The image above shows this feature in action.
You can also configure the optimizer to prioritize MACD strategies that achieve the highest win rate!
The image above shows this feature in action.
Instructions
The instructions below show a rudimentary approach to using the optimizer.
1. Build your strategy in the settings.
You should also disable the "Run a Backtest" feature to improve load times during optimization.
The image above shows my custom strategy settings.
Now that you've got some data on your chart - you should try "Freezing" the "Smoothing" setting for MACD . When doing this, the optimizer will test hundreds of MACD settings with a fixed "Smoothing" setting. Try using the best "Smoothing" setting you were able to find for your initial testing.
2. Take the best "Smoothing" setting and test various MACD and Signal Lengths.
The image above shows me configuring the MACD Optimizer to test different MACD line lengths and Signal line lengths with a fixed "smoothing" setting.
From the results, we can see that there are better MACD settings than what was shown in our initial test!
With this information we can execute a TradingView backtest.
3. Execute a TradingView Backtest.
You must enable the "Run a Backtest" feature to perform a TradingView backtest. Additionally, it's advised to enable the "STOP OPTIMIZATION" feature when performing a TradingView backtest. Enabling this feature will improve load times for the backtest to only a few seconds (since the optimizer won't look for the best setting when this feature is enabled).
The image above shows completion of the process!
From here, you can perform further testing, set alerts, etc.
Backtest Settings Shown
Initial Capital: The initial capital used for the shown backtests is $3,500 USD. Set the initial capital to replicate your true starting capital (: PnL for the MACD strategies (listed in table) is calculated using a starting capital of $10,000 USD.
Slippage: The slippage settings for the displayed backtest was set to 2 ticks.
Commission: Commission was adjusted to 0.1%.
Verify Price for Limit Orders was set to 2 ticks.
Optimization
Trading system optimization is immensely advantageous when executed with prudence.
Technical-oriented, mechanical trading systems work when a valid correlation is methodical to the extent that an objective, precisely-defined ruleset can consistently exploit it. If no such correlation exists, or a technical-oriented system is erroneously designed to exploit an illusory correlation (absent predictive utility), the trading system will fail.
Evaluate results practically and test parameters rigorously after discovery. Simply mining the best-performing parameters and immediately trading them is unlikely a winning strategy. Put as much effort into testing strong-performing parameters and building an accompanying system as you would any other trading strategy. Automated optimization involves curve fitting - it's the responsibility of the trader to validate a replicable sequence or correlation and the trading system that exploits it.
Thanks for checking this out!
Skrip berbayar

Three Bars Play Strategy [JoseMetal]============
ENGLISH
============
- Description:
This strategy is based on two simple candlestick patterns (you can pick between 2 variants) with an extra option to require trigger candles to be opposite to the closing one (explained below).
There are several customizable settings such as take profit, stop loss and break even (all based on ATR).
You can customize starting and ending date for the testings.
Other options such as allow switch position if strategy SHORTs when you are LONG and vice versa.
There's an additional optional EMA filter.
- LONG / SHORT ENTRY:
Original pattern: for LONG, current candle must close ABOVE the HIGH of previous candle and the candle 3 positions back, opposite conditions for SHORT.
Variant pattern: for LONG, the current candle must close ABOVE the HIGH of the previous candle and the candle before that one too, opposite conditions for SHORT.
Optional: require the trigger candles to be opposite, ex: for LONG you need the previous candles to be RED (bearish).
Optional: EMA filter, price must be ABOVE for LONGs, below for SHORTs.
- EXIT CONDITION:
Stop Loss or Take Profit, based on ATR.
- Visual:
The script prints the Take Profit as a GREEN line, Stop Loss as a RED line and entry price with a WHITE line.
If enabled, the Break Even required price is BLUE, and the new Stop Loss level (for break even or protecting profit) is AQUA.
- Recommendations:
This strategy is great on DAILY on most assets, including crypto, forex and gold.
12H seems to work in most cases, lower timeframes are worse.
- Customization:
You can customize indicator settings (ATR, EMA...).
Stop Loss and Take Profit ATR multipliers are also customizable.
The break even is optional, required level and break even levels (also based on ATR) are custom too.
Almost everything is customizable, for colors and plotting styles check the "Style" tab.
Enjoy!
============
ESPAÑOL
============
- Descripción:
Ésta estrategia se basa en dos patrones simples de velas (puedes elegir entre 2 variantes) con una opción extra para requerir que las velas de activación sean opuestas a la de cierre (se explica más adelante).
Hay varios ajustes personalizables como el take profit, el stop loss y el break even (todos basados en el ATR).
Puedes personalizar la fecha de inicio y finalización de las pruebas.
Otras opciones como permitir el cambio de posición si la estrategia cambie a SHORT cuando está LONG y viceversa.
Hay un filtro de EMA opcional adicional.
- ENTRADA LARGA / CORTA:
Patrón original: para LONG, la vela actual debe cerrar POR ENCIMA del ALTO de la vela anterior y de la vela 3 posiciones atrás, condiciones opuestas para SHORT.
Patrón variante: para LONG, la vela actual debe cerrar POR ENCIMA del ALTO de la vela anterior y la vela anterior a esa también, condiciones opuestas para SHORT.
Opcional: requiere que las velas de activación sean opuestas, por ejemplo: para LONG requiere que las velas anteriores sean ROJAS (bajistas).
Opcional: fltro EMA, el precio debe estar POR ENCIMA para los LONGs, por debajo para los SHORTs.
- CONDICIÓN DE SALIDA:
Stop Loss o Take Profit, basado en el ATR.
- Visual:
El script dibuja el Take Profit como una línea VERDE, el Stop Loss como una línea ROJA y el precio de entrada con una línea BLANCA.
Si está habilitado, el precio de break even requerido es AZUL, y el nuevo nivel de Stop Loss (para el break even o asegurar ganancias) es CELESTE.
- Recomendaciones:
Ésta estrategia es estupenda en DIARIO en la mayoría de los activos, incluyendo criptos, fórex y oro.
En 12H parece funcionar en la mayoría de los casos, las temporalidades inferiores son peores.
- Personalización:
Puedes personalizar la configuración de los indicadores (ATR, EMA...).
Los multiplicadores de Stop Loss y Take Profit ATR también son personalizables.
El break even es opcional, el nivel requerido y los niveles de break even (también basados en ATR) son personalizables también.
Casi todo es personalizable, para los colores y estilos de trazado compruebe la pestaña "Estilo".
¡Que lo disfrutes!

Double Inside Bar & Trend Strategy - KaspricciDouble Inside Bar & Trend Strategy - Kaspricci
This strategy combines the Double Inside Bar candlestick pattern with a trend filter. Once the second inside bar closes and price is above trend moving average, a buy stop order is placed at high of the candle. If price is below trend moving average, a sell stop order is placed at the low of the candle.
This strategy is for educational purposes only! It is not meant to be a financial advice.
Settings
Trend source, type of moving average and length for calculating trend
Stop Loss Type - default: ATR. You can switch between stop loss calculation based on Average True Range value or fixed value.
ATR Length / Factor / TP Ratio - default: 14 / 2.0 / 2.0. Used to calculate the Stop Loss as ATR * Factor and Take Profit as Stop Loss * TP Ratio.
FIX Stop Loss / Take Profit - default: 10 pips / 20 pips. In case you select Stop Loss Type = FIX, these value swill be used.
Risk in % - default: 1%, option to adjust the quantity of a trade based on a defined risk percentage. If enabled, it will overwrite the quantity parameter of the strategy settings.
On top you can filter trades by start and end date as well as time of the day.
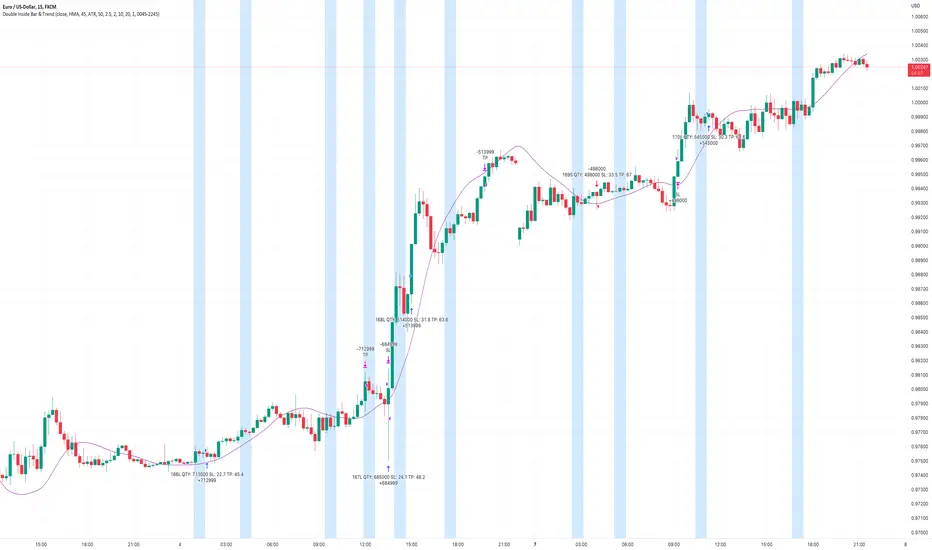
The Only EURUSD Trading Strategy You Need - KaspricciThe Only EURUSD Trading Strategy You Need
I got the idea to this strategy from a youtube video uploaded by Trade Beta. It is designed to capture the early market move of major forex pair EURUSD at beginning of New York Stock Exchange (13:30 GMT). Trade Beta tested his strategy on the 5 minute chart. I have set all parameters to same values as shown in the video.
The strategy creates two pending orders at the recent swing high and low. Once the first pending order entered, the remaining one is cancelled. Latest at the end of market session all pending orders are cancelled and all open trade are closed as well.
In rare case that price at session opening is above swing high, only a pending sell stop order is created at swing high price. And in case price is below swing low, a pending buy stop order is created.
Settings
Trading Time - default: New York Stock Exchange opening hours. Pending orders are created at the close of the first candle within the session.
Swing High Source / Bars - default: High / 5 bars. Used to find the latest swing high within a range of 5 bars left and right. Price is used for buy stop order.
Swing Low Source / Bars - default: Low / 5 bars. Used to find the latest swing low within a range of 5 bars left and right. Price is used for sell stop order.
Stop Loss Type - default: ATR. You can switch between stop loss calculation based on Average True Range value or fixed value.
ATR Length / Factor / TP Ratio - default: 14 / 2.0 / 2.0. Used to calculate the Stop Loss as ATR * Factor and Take Profit as Stop Loss * TP Ratio.
FIX Stop Loss / Take Profit - default: 10 pips / 20 pips. In case you select Stop Loss Type = FIX, these value swill be used.
This strategy is for educational purposes only! It is not meant to be a financial advice.

EMA + Williams Fractal Pullback [Trading Nerd]EMA Pullback Strategy with Williams Fractal Indicator
Backtesting script that searches for trends (long and short) and a following pullback into the EMAs. It enters on the first Williams Fractal in the desired direction. I found the Strategy on YouTube as a "M1 Scalping Strategy for Bitcoin".
Including fees the strategy is not profitalbe in lower timeframes (at least if not optimized). But it seems to work on higher timeframes as a swing traiding strategy.
Strategy Conditions
Longs:
EMA 1 > EMA 2 and EMA 2 > EMA 3
Number of need to be above the EMA 1
Then a Pullback into the EMAs is required
Enter on the first bullish Williams Fractal
Signal is canceled if the price closes below the EMA 3
Shorts:
EMA 1 < EMA 2 and EMA 2 < EMA 3
Number of need to be below the EMA 1
Then a Pullback into the EMAs is required
Enter on the first bearish Williams Fractal
Singal is canceled if the price closes above the EMA 3
Take Profit
A Risk Reward Take Profit is possible. If you want to use only a trailing Stop Loss, you can set the Take Profit to 'None'
Stop Loss
The default Stop Loss is EMA. If the Pullback has not reached the EMA 2, the Stop Loss is set to the EMA 2. If the Pullback has reached the EMA 2, the Stop Loss is set to the EMA 3.
Other Stop Loss types are available: ATR, HH/LL
Trailing Stop Loss
Available trailing Stop Loss types: ATR, HH/LL. Best practice is to also set the Stop Loss type to the same value.
The Stop Loss is updated if the value from the latest closed candle is greater/less than the previous value for a long/short trade.
Additional
Time Filter: Only opens trade in the defined Session. Open trades are still being closed outside of the Session.
Start Date/End Date: Limits the backtest for the defined Date Range
Trading Days: Only open Trades on the checked Days
Risk % per Trade: If enabled the Strategy uses X% of the capital (defined in Settings -> Properties -> Initial Capital)
Use Compound Interest: If enabled Capital is recalculated for every trade (initial capital + net Profit)
IMPORTANT: For low Timeframes and Markets with tight SL (like Forex) it requires a lower Margin Percent than default. Go to Settings->Properties and lower the required Long/Short Margin. Otherwise Trades might not be considered because of too less capital/marign. Margins can e.g. set to: 2% (Forex), 10% (Stocks), 20% (Crypto).
